August 2014 - Cloud Network

Networking | Support | Tricks | Troubleshoot | Tips

Buymecoffe

Buy Me A Coffee

Thursday, August 28, 2014

How to Stepup Crontab Scheduler from Terminal command in Linux

August 28, 2014
How to Stepup Crontab Scheduler from Terminal command in Linux
Crontab Scheduler
###Cron - Scheduler###
 Features:
  1. Scheduler
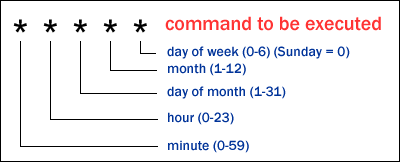
  2. Rules (Cron entries) are based on times:
   a. minute (0-59)
   b. hour (0-23)
   c. day of the month (1-31)
   d. month (1-12)
   e. day of the week (Sun,Mon,Tue, etc. OR 0-7)
   f. command to execute (shell, perl, php, etc.)
 3. Wakes up every minute in search of programs to execute
 4. Reads cron entries from multiple files
 5. Maintains per-user and system-wide (/etc/crontab) schedules

/etc:
cron.d/       
cron.deny - denies cron execution by user
cron.monthly/ - runs jobs monthly
cron.weekly/ - runs jobs weekly  
cron.daily/ - runs jobs daily
cron.hourly/ - runs jobs hourly
crontab - contains system-wide schedules

Note: '*' wildcard in a time column means to run for all values

Per-user Crontabs:
Stored in: /var/spool/cron

Task: 
  1. Create a cron entry for the user 'student1'
   a. su student1
   b. crontab -e
   c. create an entry, minus the name of the user

Note: 'crontab -l' - enumerates per-user cron entries


System-wide Crontab:
Stored in: /etc/crontab

Task:
  1. Create a cron entry in: /etc/crontab

Note: 'crontab -l -u username' - enumerates per-user cron entries


Thanking you
Hope U Like it.....

Windows Server 2008

Notepad

Python 3.4.1

Nagios 4

Oracle Linux 7
How to Install Linux Mint 17

How to Creating Your Own Repository Using Command Mode

August 28, 2014
How to Creating Your Own Repository Using Command Mode
Own Repository


Creating your own repository
Step 1) Check if the package is installed if not install the package : create repo
Step 2) Make a directory for repository
createrepo /root/<Directory-name>
Step 3) Edit the main configuration file
/etc/yum.repos.d/rhel-debuginfo.repo
Edit according to the below configurations
#[rhel-debuginfo]
#name=Red Hat Enterprise Linux $releasever - $basearch - Debug
#baseurl=ftp://10.10.19.30/pub/ (your directory path of RPMs)
#enabled=1
#gpgcheck=0
#gpgkey=file:///etc/pki/rpm-gpg/RPM-GPG-KEY-redhat-release
Step 4) Edit the yum.conf file
/etc/yum.comf
Set the gpgcheck=0
Step 5 ) Update repository
Yum update
Step 5 ) Install any software from repository
Yum install <rpm-name>


Thanking you
Hope U Like it.....

Ubuntu 14.04

Lamp Installation in Ubuntu

Root Password Reset in Ubuntu

Linux Mint 17

Own Blogger Website
Install Free BSD

What is chmod and Completely about its Permissions

August 28, 2014
What is chmod and Completely about its Permissions
chmod 775

What: 'chmod' is a utility to set the mode (chmod = CHange MODe)
of a file or directory. The 'mode' dictates who on the system
may access a file. The mode is also known as 'permissions'.

literal syntax: "Set the mode of that file to..."
"What are the permissions on that directory?"

Why: Many people don't fully understand the importance of file permissions
on a Unix system. Furthermore, using Alpha notation may cause
incorrect permissions because you are not fully qualifying the
permissions of the file, only adding or removing permissions.
Over time, or via the use of scripts and utilities, these
permissions can be set to undesirable modes that may not be suitable
for a secure environment.


Info: CHMOD(1V) is used to change the permissions (mode) of a file or
files. Only the owner of a file (or the super-user) may change
its mode.


Lets start out by looking at a common directory entry in unix. We are
going to use "ls -alF" to obtain the list. (More on 'ls' in a later file).

-rw-r--r-- 1 jericho 2520 Jan 9 09:46 .plan
lrwxrwxrwx 1 root 9 Oct 1 19:42 .rhosts -> /dev/null
drwx------ 4 jericho 4096 Jan 9 10:29 bin/
-rw------- 1 jericho 1349 Jan 6 14:49 header.file.2

Above are 4 different kinds of entries we may find. The first part of each
entry is the file permissions associated with that file. It determines who
can read, write, or execute a file. There are 10 flags for each file, as
listed below:

---------------------------------------------------
| ft | ur | uw | ux | gr | gw | gx | or | ow | ox |
---------------------------------------------------

ft - file type. This tells you what kind of 'file' you are listing. Take
into account the word 'file' is vague, and does not necessarily mean "text
file" necessarily. Unix treats everything as a file (directories, links,
etc), and denotes these special permissions to differentiate one from
another. Common file types:

- regular file
d directory
l symbolic link
c character device
b block device
s socket device

Character devices, Block devices, and Sockets are frequently found in
the /dev directory, and will be talked about later. The kinds
of files we will look at for now are regular files, directories, and take
a brief look at symbolic links.

For the other nine entries, you have different combinations of the following:

u = user r = read
g = group w = write
o = other x = execute

Permissions control access for a file or directory by breaking
it down into three access categories: user, group, and
other.

User: Controlls access for the owner of the file.

Group: Controlls access for all members of the group that
owns the file.

Other: Controlls access to anyone else on the system,
regardless of them owning the file or being in a
group that owns a file.

In the syntax above, read means the ability to read the contents of that
file, write means modifying, removing, or appending to a file, and execute
means 'running' the file (or if it is a directory, the ability to enter it).


When using chmod to set or change file permissions, there
are two notations that are recognized:

Alpha: Use of the + and - operators to change one of
the three types of access for each category.
r, w, and x which represent read, write and
execute respectively. Alpha notation is also known
as 'Symbolic Mode'. For example:
chmod u+rw,g+r,o+r filename

Octal: Use of a three or four digit octal number to
change the absolute permissions of a file. Using
octal notation sets all access permissions each
time it is used. Octal notation is also known
as 'Absolute Mode'. For example:
chmod 644 filename

Changing the permissions: (we will get to the 'why' after this)

Many people that are new to unix will use Alpha representation to change the
permission of a file. Lets say we have a file called 'readme' with
permissions of -rw-r--r-- .. that means I (user) can read/write, while
people in the group or other can only read it. Using alpha notation, I
may do the following:

chmod go-r readme

What we are saying here is to remove the 'read' ability for 'group' and
'other'. That changes the file from -rw-r--r-- to -rw------- . If we
were to do:

chmod go+rx readme

We are now adding read and execute privilege for group and other. So now it
would go from -rw------- to -rw-r-xr-x . This would make it so even though
we own the file, we can't execute it ourselves. This little oversight would
cause us to have to chmod again. While this doesn't sound particularly bad,
consider it from a security standpoint. If an admin uses alpha notation, it
would be easy for him to overlook permissions that could lead to problems.
Because of the chance for accidentally setting incorrect permissions, it
is a good idea to learn and use Octal Notation whenever possible. Why is it
called "absolute mode"? Because every time you set the mode of the file,
you are fully qualifying the permissions. Instead of adding or removing
permissions, you are giving the file its new permissions, as if from scratch.

Instead of the r/w/x and u/g/o method described above, we use numbers
and placement to determine the new mode. Below are the basic modes
and their Octal representation. While this looks like a lot to remember,
I will show how it is actually easier and more efficient than Alpha.

400 Read by owner.
200 Write by owner.
100 Execute (search in directory) by owner.

040 Read by group.
020 Write by group.
010 Execute (search) by group.

004 Read by others.
002 Write by others.
001 Execute (search) by others.

4000 Set user ID on execution. (SUID)
2000 Set group ID on execution (SGID)
1000 Sticky bit, (see chmod(2V) for more information).

We will go into SUID, SGID, and sticky bit in the future. As a user, you
will have little need to set those yourself. As an admin, they will
become very important to functionality and security of your system.

Whenever you set the mode with Octal notation, you will always use either
three or four numbers to do so. The only time you use four is if you are
dealing with a special mode like SUID or SGID. In all other cases, you
are using three. The first number deals with r/w/x privs for the user, the
second number deals with r/w/x privs for group, and the third for other.

Look at the above list and see how they form together with the examples
below:
444 = -r--r--r-- (readable to everyone)
110 = ---x--x--- (executable to user/group)
421 = -r---w---x (read/user, write/group, execute/other)


Now, we need to look at setting multiple flags for a single category. What
if we want the user to read AND write? If you notice the numbers used,
you may have noticed they skipped the use of 3. Why? Because any combination
of adding 1, 2, and 4 will create new numbers with no duplication. 1+2 = 3,
1+4 = 5, 2+4 = 6, and 1+2+4 = 7. By adding the base 1/2/4 numbers, we
obtain the numeric representation for assigning multiple attributes
to a file. For example, if we want read and write, we add 4 and 2,
and apply that.

644 = -rw-r--r-- (read/write user, read group/other)

If we want to give read/write/exec to user, we add up 4, 2, and 1 and apply
that.

755 = -rwxr-xr-x (r/w/x user, r/x for group and other)


Other: There are other options with chmod that are nice to know. Take into
account that not all versions of chmod will conform to the options
I will describe. You can "man chmod" on your system to see what
those options are.

-f Force. chmod will not complain if it fails to change
the mode of a file.

-R Recursively descend through directory arguments, set-
ting the mode for each file as described above. When
symbolic links are encountered, their mode is not
changed and they are not traversed.

(remember, unix is case sensitive. 'R' is not 'r')

If you use wildcards, most implementations of chmod will not set permissions
of files that contain a . at the beginning of the file name if you use
wildcards. For instance, 'chmod 755 *' would set the permissions on all
the files in the current directory to -rwxr-xr-x EXCEPT files containing
a . at the beginning of their name. In order to wildcard chmod these files,
you would have to 'chmod 755 .*'

So when is it good to know alpha notation? You may not know the current
permissions when writing a script that calls chmod to perform a mode change.
This would make it awkward to reset the permissions via Octal notation. Making
chmod add or remove permissions would then be more efficient. For example:

chmod u-x readme Remove execute permissions for user.
chmod go-rwx readme Remove all right for group/other.

What does this have to do with system penetration? First and foremost,
every unix user and security professional should know how to use the
system they are attacking or securing. You can not effectively
test or secure a unix box if you don't know how to use it as a standard
user would. Second, when you compile programs or run scripts on a system,
you have to be able to permission them in order to run them.

Carole Fennelly writes in reminding us that there are a few times where
alpha notation may be the better option. There is an option to chmod (-R)
that will traverse a directory structure to change the modes of all files
and subdirectories in the tree. For example, if you are in the directory
/usr/local/httpd, you could enter:

chmod -R 755 *

Which will go through and make every file and subdirectory under
/usr/local/httpd "rwxr-xr-x" . This may not be what you want. If you only want
to make sure that there is no file or directory that is world writable and you
want to preserve the other permissions, it is better to use the command:

chmod -R o-w *

For large directory trees, it is unlikely that every file and subdirectory
should have the same permission and the octal (absolute) value could cause
problems.

Thanking You
Hope U Like it...

Ubuntu 14.04

Linux Mint 17

Python

Nagios

Oracle Linux 7
Reset Root Password

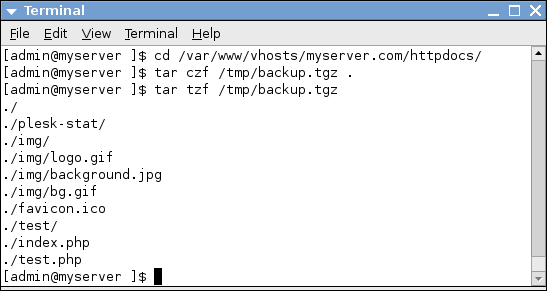
What is Tar and How to take Backup Using (Tar, Gzip, Bzip2, Zip)

August 28, 2014
What is Tar and How to take Backup Using (Tar, Gzip, Bzip2, Zip)
Tar, Gzip, Bzip2, Zip
###Tar, Gzip, Bzip2, Zip###
Features:
 1. Compression utilities (gzip, bzip2, zip)
 2. File rollers (the ability to represent many files as one)

Gzip:
Includes:
 1. gzip - compresses/decompresses files
 2. gunzip - decompresses gzip files

Tasks:
 1. compress '1million.txt' file using gzip
  a. gzip -c 1million.txt > 1million.txt.gz

Note: gzip auto-dumps to STDOUT, by default

  b. gzip -l 1million.txt.gz - returns status information
  c. gunzip 1million.txt.gz - dumps to file, and removes compressed version
  d. gzip -d 1million.txt.gz
  e. zcat 1million.txt.gz - dumps the contents to STDOUT
  f. less 1million.txt.gzip - dumps the contents of gzip files to STDOUT


Bzip2:

 1. bzip2 -c 1million.txt > 1million.txt.bz2

Note: Bzip2 tends to outperform gzip on larger files
 2. bunzip2 1million.txt.bz2
 3. bzip2 -d 1million.txt.bz2
 4. bzcat 1million.txt.bz2 - dumps contents to STDOUT
 5. less 1million.txt.bz2 - also dumps the contents to STDOUT


Zip & unzip:
 1. zip filename.zip path/ - general usage
 2. zip 1million.txt.zip 1million.txt
Note: zip differs slight from gzip and bzip2 in that the destination file (resultant zip file) is specified before the source
 3. unzip 1million.txt.zip


Tar & Gzip/Bzip2:

 1. tar -cvf filename.tar path/ - creates a non-compressed archive
 2. tar -cvf 1million.txt.tar 1million.txt
Note: tar, requires a small overhead for itself in each file

 3. tar -czvf 1million.txt.tar.gz 1million.txt - creates, tar/gzip document
 4. tar -cjvf 1million.txt.tar.bz2 1million.txt - creates, tar/bzip2 document
 5. tar -tzvf

 6. tar -cjvf 1million.txt.tar.bz2 1million.txt testRH5/- creates, tar/bzip2 document for the text file and 'testRH5' directory tree.


Thanking You
Hope U like it....

Fedora 20 in Virtual box

Roboform in linux

Ubuntu server 12.04

Nagios 4.0.7

Oracle Linux 7
Free BSD 10

What is AWK & its Tutorial with Variables, Arrays and Regular Expressions and Blocks

August 28, 2014
What is AWK & its Tutorial with Variables, Arrays and Regular Expressions and Blocks
Awk Variable

Why awk? 

The Awk text-processing programming language and is a useful tool for manipulating text.
Awk recognizes the concepts of "file", "record", and "field".
 A file consists of records, which by default are the lines of the file. One line becomes one record.  Awk operates on one record at a time.
A record consists of fields, which by default are separated by any number of spaces or tabs.
Field number 1 is accessed with $1, field 2 with $2, and so forth. $0 refers to the whole record.
[awkuser@p3nlh096 ~]$ awk -help
Usage: awk [POSIX or GNU style options] -f progfile [--] file ...
Usage: awk [POSIX or GNU style options] [--] 'program' file ...
POSIX options: GNU long options:
-f progfile --file=progfile
-F fs --field-separator=fs
-v var=val --assign=var=val
-m[fr] val
-W compat --compat
-W copyleft --copyleft
-W copyright --copyright
-W dump-variables[=file] --dump-variables[=file]
-W exec=file --exec=file
-W gen-po --gen-po
-W help --help
-W lint[=fatal] --lint[=fatal]
-W lint-old --lint-old
-W non-decimal-data --non-decimal-data
-W profile[=file] --profile[=file]
-W posix --posix
-W re-interval --re-interval
-W source=program-text --source=program-text
-W traditional --traditional
-W usage --usage
-W version --version

To report bugs, see node `Bugs' in `gawk.info', which is
section `Reporting Problems and Bugs' in the printed version.

gawk is a pattern scanning and processing language.
By default it reads standard input and writes standard output.

Examples:
gawk '{ sum += $1 }; END { print sum }' file
gawk -F: '{ print $1 }' /etc/passwd


Now, for an explanation of the { print } code block. In awk, curly braces are used to group blocks of code together, similar to C. Inside our block of code, we have a single print command. In awk, when a print command appears by itself, the full contents of the current line are printed.
$ awk '{ print $0 }' /etc/passwd

output
-------
root:x:0:0:root:/root:/bin/bash
daemon:x:1:1:daemon:/usr/sbin:/bin/sh
bin:x:2:2:bin:/bin:/bin/sh
sys:x:3:3:sys:/dev:/bin/sh
sync:x:4:65534:sync:/bin:/bin/sync
...

In awk, the $0 variable represents the entire current line, so print and print $0 do exactly the same thing.
$ awk '{ print "" }' /etc/passwd

$ awk '{ print "hello" }' /etc/passwd
Running this script will fill your screen with hello's.
AWK Variables 
awk variables are initialized to either zero or the empty string the first time they are used.
Variables
  Variable declaration is not required
  May contain any type of data, their data type may change over the life of the program
  Must begin with a letter and continuing with letters, digits and underscores
  Are case senstive
  Some of the commonly used built-in variables are:
  • NR -- The current line's sequential number
  • NF -- The number of fields in the current line
  • FS -- The input field separator; defaults to whitespace and is reset by the -F command line parameter
/test$ cat calc
3 56
567 89
/test$ awk '{d=($2-($1-4));s=($2+$1);print d/sqrt(s),d*d/s }' calc
7.42077 55.0678
-18.5066 342.494
/test$
in above example we have a file calc with two rows and two columns. Note that the final statement, a "print" in this case, does not need a semicolon. It doesn't hurt to put it in, though.

Integer variables can be used to refer to fields. If one field contains information about which other field is important, this script will print only the important field:
$ awk '{imp=$1; print $imp }' calc

The special variable NF tells you how many fields are in this record. This script prints the first and last field from each record, regardless of how many fields there are:
if now calc file is
3 56 abd
567 89 xyz
$ awk '{print $1,$NF }' calc
3 abd
567 xyz

Begin and End
Any action associated with the BEGIN pattern will happen before any line-by-line processing is done. Actions with the END pattern will happen after all lines are processed.
1.One is to just mash them together, like so:
>

awk 'BEGIN{print"fee"} $1=="foo"{print"fi"}
END{print"fo fum"}' filename

AWK Arrays
awk has arrays, but they are only indexed by strings. This can be very useful, but it can also be annoying. For example, we can count the frequency of words in a document (ignoring the icky part about printing them out):
$ awk '{for(i=1;i <=NF;i++) freq[$i]++ }' filename

The array will hold an integer value for each word that occurred in the file. Unfortunately, this treats "foo", "Foo", and "foo," as different words. Oh well. How do we print out these frequencies? awk has a special "for" construct that loops over the values in an array. This script is longer than most command lines, so it will be expressed as an executable script:
#!/usr/bin/awk -f
{for(i=1;i <=NF;i++) freq[$i]++ }
END{for(word in freq) print word, freq[word]
}

AWK Regular expressions and blocks

awk '/pattern_to_match/ {actions}' input_file

awk '/foo/ { print }' abc.txt

cat abc.txt|awk '/[0-9]+.[0-9]*/ { print }'


Expressions and blocks
fredprint

$1 == "fred" { print $3 }

root

$5 ~ /root/ { print $3 }
AWK Conditional statements
awk '{
if ( $1 ~ /root/ )
{
print $1
}
}' /etc/passwd

Both scripts function identically. In the first example, the boolean expression is placed outside the block, while in the second example, the block is executed for every input line, and we selectively perform the print command by using an if statement. Both methods are available, and you can choose the one that best meshes with the other parts of your script.
if
{
if ( $1 == "foo" ) {
if ( $2 == "foo" ) {
print "uno"
} else {
print "one"
}
} else if ($1 == "bar" ) {
print "two"
} else {
print "three"
}
}


if
! /matchme/ { print $1 $3 $4 }
{
if ( $0 !~ /matchme/ ) {
print $1 $3 $4
}
}

Both scripts will output only those lines that don't contain a matchme character sequence. Again, you can choose the method that works best for your code. They both do the same thing.

( $1 == "foo" ) && ( $2 == "bar" ) { print }

This example will print only those lines where field one equals foo and field two equals bar.


Thanking You
Hope U like it....

Ubuntu 14.04

Linux Mint 17

Ubuntu Root Password Reset

Lamp in Ubuntu 14.04

Redhat Linux 7 server
Gentoo Linux 12.1

Automatic SSH / SSH Login Without Password

August 28, 2014
Automatic SSH / SSH Login Without Password

SSH With Login and Without Login
SSH is a secure clone of RSH with RSA encryption based authentication. This article tells you how to use ssh without having to type in your password every time you use 'ssh'.
0.   The basis of using ssh without typing your password is public key based authentication. You need to generate a pair of public/private keys for this. Make sure you have 'ssh-keygen' in your  PATH. There are two versions of 'ssh-keygen' using SSHv1 and SSHv2 correspondingly.
1. Firstly, generate your public/private keys using ssh-keygen

type 'ssh-keygen' ( for SSHv1). This will generate 'identity' and 'identity. pub' in the .ssh directory in your home directory.

type 'ssh-keygen -t rsa' (for SSHv2). This will generate 'id_rsa' and 'id_rsa.pub' in the .ssh directory in your home directory.
Note: To simplify the case, no 'passphrase' is used. This could be dangerous if someone else have access to your 'identity' or 'id_rsa' file, be careful with these files (but not those *.pub file).
2. Copy the *.pub file to the .ssh directory of the remote host you want to logon to and rename *.pub as 'authorized_keys' or 'authorized_keys2'. Use 'scp' for this copying:
type 'scp ~user1/.ssh/identity. pub user2@remotehost:~user2/.ssh/authorized_keys' for SSHv1
type 'scp ~user1/.ssh/id_rsa.pub user2@
remotehost:~user2/.ssh/authorized_keys2' for SSHv2
'user1' and 'user2' can be the same or different as long as you have access for both of them. You are basically telling the SSH daemon on the remote machine to encrypt the connection with this public key and that this key is "pre-authorized" using the SSH protocol given in 'authorized_keys' file. In this way, no password is needed for SSH connection.
Note: If you have more than one host from which you want to connect to the remote host, you need to add the content of local host's *.pub file as one line in the 'authorised_keys' file of the remote host, i.e. one host per line.
3. Your public key based authentication has been setup. You won't be asked your password when ssh to the remote machine:

type 'ssh
user2@remotehost' or simply 'ssh remotehost' (if user1=user2)
Voila ! You'll be logged in without typing in your password.
Note: If 'ssh' between machines using different versions of SSH, you might need to do two versions at the same time to guarantee the success.


Thanking You
Hope U Like it..........

Reset Root Password in linux

Linux Mint 17

pendrive bootable for ubuntu

Nagios 4.0.7

Oracle Linux 7
Fedora 20

20 Linux System Monitoring Tools

August 28, 2014
20 Linux System Monitoring Tools
20 Linux System Monitoring Tools Every SysAdmin Should Know

Need to monitor Linux server performance? Try these built-in command and a few add-on tools. Most Linux distributions are equipped with tons of monitoring. These tools provide metrics which can be used to get information about system activities. You can use these tools to find the possible causes of a performance problem. The commands discussed below are some of the most basic commands when it comes to system analysis and debugging server issues such as:

1. Finding out bottlenecks.
2. Disk (storage) bottlenecks.
3. CPU and memory bottlenecks.
4. Network bottlenecks.

#1: top - Process Activity Command

The top program provides a dynamic real-time view of a running system i.e. actual process activity. By default, it displays the most CPU-intensive tasks running on the server and updates the list every five seconds.

Commonly Used Hot Keys
The top command provides several useful hot keys:
Hot Key
Usage
t
Displays summary information off and on.
m
Displays memory information off and on.
A
Sorts the display by top consumers of various system resources. Useful for quick identification of performance-hungry tasks on a system.
f
Enters an interactive configuration screen for top. Helpful for setting up top for a specific task.
o
Enables you to interactively select the ordering within top.
r
Issues renice command.
k
Issues kill command.
z
Turn on or off color/mono

=> Related: How do I Find Out Linux CPU Utilization?
#2: vmstat - System Activity, Hardware and System Information
The command vmstat reports information about processes, memory, paging, block IO, traps, and cpu activity.
# vmstat 3
Sample Outputs:
procs -----------memory---------- ---swap-- -----io---- --system-- -----cpu------
 r  b   swpd   free   buff  cache   si   so    bi    bo   in   cs us sy id wa st
 0  0      0 2540988 522188 5130400    0    0     2    32    4    2  4  1 96  0  0
 1  0      0 2540988 522188 5130400    0    0     0   720 1199  665  1  0 99  0  0
 0  0      0 2540956 522188 5130400    0    0     0     0 1151 1569  4  1 95  0  0
 0  0      0 2540956 522188 5130500    0    0     0     6 1117  439  1  0 99  0  0
 0  0      0 2540940 522188 5130512    0    0     0   536 1189  932  1  0 98  0  0
 0  0      0 2538444 522188 5130588    0    0     0     0 1187 1417  4  1 96  0  0
 0  0      0 2490060 522188 5130640    0    0     0    18 1253 1123  5  1 94  0  0

Display Memory Utilization Slabinfo
# vmstat -m

Get Information About Active / Inactive Memory Pages
# vmstat -a

=> Related: How do I find out Linux Resource utilization to detect system bottlenecks?
#3: w - Find Out Who Is Logged on And What They Are Doing
w command displays information about the users currently on the machine, and their processes.
# w username
# w vivek
Sample Outputs:
 17:58:47 up 5 days, 20:28,  2 users,  load average: 0.36, 0.26, 0.24
USER     TTY      FROM              LOGIN@   IDLE   JCPU   PCPU WHAT
root     pts/0    10.1.3.145       14:55    5.00s  0.04s  0.02s vim /etc/resolv.conf
root     pts/1    10.1.3.145       17:43    0.00s  0.03s  0.00s w
#4: uptime - Tell How Long The System Has Been Running
The uptime command can be used to see how long the server has been running. The current time, how long the system has been running, how many users are currently logged on, and the system load averages for the past 1, 5, and 15 minutes.
# uptime
Output:
 18:02:41 up 41 days, 23:42,  1 user,  load average: 0.00, 0.00, 0.00
1 can be considered as optimal load value. The load can change from system to system. For a single CPU system 1 - 3 and SMP systems 6-10 load value might be acceptable.
#5: ps - Displays The Processes
ps command will report a snapshot of the current processes. To select all processes use the -A or -e option:
# ps -A
Sample Outputs:
  PID TTY          TIME CMD
    1 ?        00:00:02 init
    2 ?        00:00:02 migration/0
    3 ?        00:00:01 ksoftirqd/0
    4 ?        00:00:00 watchdog/0
    5 ?        00:00:00 migration/1
    6 ?        00:00:15 ksoftirqd/1
....
.....
 4881 ?        00:53:28 java
 4885 tty1     00:00:00 mingetty
 4886 tty2     00:00:00 mingetty
 4887 tty3     00:00:00 mingetty
 4888 tty4     00:00:00 mingetty
 4891 tty5     00:00:00 mingetty
 4892 tty6     00:00:00 mingetty
 4893 ttyS1    00:00:00 agetty
12853 ?        00:00:00 cifsoplockd
12854 ?        00:00:00 cifsdnotifyd
14231 ?        00:10:34 lighttpd
14232 ?        00:00:00 php-cgi
54981 pts/0    00:00:00 vim
55465 ?        00:00:00 php-cgi
55546 ?        00:00:00 bind9-snmp-stat
55704 pts/1    00:00:00 ps
ps is just like top but provides more information.
Show Long Format Output
# ps -Al
To turn on extra full mode (it will show command line arguments passed to process):
# ps -AlF
To See Threads ( LWP and NLWP)
# ps -AlFH
To See Threads After Processes
# ps -AlLm
Print All Process On The Server
# ps ax
# ps axu
Print A Process Tree
# ps -ejH
# ps axjf
# pstree
Print Security Information
# ps -eo euser,ruser,suser,fuser,f,comm,label
# ps axZ
# ps -eM
See Every Process Running As User Vivek
# ps -U vivek -u vivek u
Set Output In a User-Defined Format
# ps -eo pid,tid,class,rtprio,ni,pri,psr,pcpu,stat,wchan:14,comm
# ps axo stat,euid,ruid,tty,tpgid,sess,pgrp,ppid,pid,pcpu,comm
# ps -eopid,tt,user,fname,tmout,f,wchan
Display Only The Process IDs of Lighttpd
# ps -C lighttpd -o pid=
OR
# pgrep lighttpd
OR
# pgrep -u vivek php-cgi
Display The Name of PID 55977
# ps -p 55977 -o comm=
Find Out The Top 10 Memory Consuming Process
# ps -auxf | sort -nr -k 4 | head -10
Find Out top 10 CPU Consuming Process
# ps -auxf | sort -nr -k 3 | head -10
#6: free - Memory Usage
The command free displays the total amount of free and used physical and swap memory in the system, as well as the buffers used by the kernel.
# free
Sample Output:
            total       used       free     shared    buffers     cached
Mem:      12302896    9739664    2563232          0     523124    5154740
-/+ buffers/cache:    4061800    8241096
Swap:      1052248          0    1052248
=> Related: :
1. Linux Find Out Virtual Memory PAGESIZE
2. Linux Limit CPU Usage Per Process
3. How much RAM does my Ubuntu / Fedora Linux desktop PC have?
#7: iostat - Average CPU Load, Disk Activity
The command iostat report Central Processing Unit (CPU) statistics and input/output statistics for devices, partitions and network filesystems (NFS).
# iostat
Sample Outputs:
Linux 2.6.18-128.1.14.el5 (www03.nixcraft.in)     06/26/2009
avg-cpu:  %user   %nice %system %iowait  %steal   %idle
           3.50    0.09    0.51    0.03    0.00   95.86
Device:            tps   Blk_read/s   Blk_wrtn/s   Blk_read   Blk_wrtn
sda              22.04        31.88       512.03   16193351  260102868
sda1              0.00         0.00         0.00       2166        180
sda2             22.04        31.87       512.03   16189010  260102688
sda3              0.00         0.00         0.00       1615          0
=> Related: : Linux Track NFS Directory / Disk I/O Stats
#8: sar - Collect and Report System Activity
The sar command is used to collect, report, and save system activity information. To see network counter, enter:
# sar -n DEV | more
To display the network counters from the 24th:
# sar -n DEV -f /var/log/sa/sa24 | more
You can also display real time usage using sar:
# sar 4 5
Sample Outputs:
Linux 2.6.18-128.1.14.el5 (www03.nixcraft.in)         06/26/2009
06:45:12 PM       CPU     %user     %nice   %system   %iowait    %steal     %idle
06:45:16 PM       all      2.00      0.00      0.22      0.00      0.00     97.78
06:45:20 PM       all      2.07      0.00      0.38      0.03      0.00     97.52
06:45:24 PM       all      0.94      0.00      0.28      0.00      0.00     98.78
06:45:28 PM       all      1.56      0.00      0.22      0.00      0.00     98.22
06:45:32 PM       all      3.53      0.00      0.25      0.03      0.00     96.19
Average:          all      2.02      0.00      0.27      0.01      0.00     97.70
=> Related: : How to collect Linux system utilization data into a file
#9: mpstat - Multiprocessor Usage
The mpstat command displays activities for each available processor, processor 0 being the first one. mpstat -P ALL to display average CPU utilization per processor:
# mpstat -P ALL
Sample Output:
Linux 2.6.18-128.1.14.el5 (www03.nixcraft.in)         06/26/2009
06:48:11 PM  CPU   %user   %nice    %sys %iowait    %irq   %soft  %steal   %idle    intr/s
06:48:11 PM  all    3.50    0.09    0.34    0.03    0.01    0.17    0.00   95.86   1218.04
06:48:11 PM    0    3.44    0.08    0.31    0.02    0.00    0.12    0.00   96.04   1000.31
06:48:11 PM    1    3.10    0.08    0.32    0.09    0.02    0.11    0.00   96.28     34.93
06:48:11 PM    2    4.16    0.11    0.36    0.02    0.00    0.11    0.00   95.25      0.00
06:48:11 PM    3    3.77    0.11    0.38    0.03    0.01    0.24    0.00   95.46     44.80
06:48:11 PM    4    2.96    0.07    0.29    0.04    0.02    0.10    0.00   96.52     25.91
06:48:11 PM    5    3.26    0.08    0.28    0.03    0.01    0.10    0.00   96.23     14.98
06:48:11 PM    6    4.00    0.10    0.34    0.01    0.00    0.13    0.00   95.42      3.75
06:48:11 PM    7    3.30    0.11    0.39    0.03    0.01    0.46    0.00   95.69     76.89
=> Related: : Linux display each multiple SMP CPU processors utilization individually.
#10: pmap - Process Memory Usage
The command pmap report memory map of a process. Use this command to find out causes of memory bottlenecks.
# pmap -d PID
To display process memory information for pid # 47394, enter:
# pmap -d 47394
Sample Outputs:
47394:   /usr/bin/php-cgi
Address           Kbytes Mode  Offset           Device    Mapping
0000000000400000    2584 r-x-- 0000000000000000 008:00002 php-cgi
0000000000886000     140 rw--- 0000000000286000 008:00002 php-cgi
00000000008a9000      52 rw--- 00000000008a9000 000:00000   [ anon ]
0000000000aa8000      76 rw--- 00000000002a8000 008:00002 php-cgi
000000000f678000    1980 rw--- 000000000f678000 000:00000   [ anon ]
000000314a600000     112 r-x-- 0000000000000000 008:00002 ld-2.5.so
000000314a81b000       4 r---- 000000000001b000 008:00002 ld-2.5.so
000000314a81c000       4 rw--- 000000000001c000 008:00002 ld-2.5.so
000000314aa00000    1328 r-x-- 0000000000000000 008:00002 libc-2.5.so
000000314ab4c000    2048 ----- 000000000014c000 008:00002 libc-2.5.so
.....
......
..
00002af8d48fd000       4 rw--- 0000000000006000 008:00002 xsl.so
00002af8d490c000      40 r-x-- 0000000000000000 008:00002 libnss_files-2.5.so
00002af8d4916000    2044 ----- 000000000000a000 008:00002 libnss_files-2.5.so
00002af8d4b15000       4 r---- 0000000000009000 008:00002 libnss_files-2.5.so
00002af8d4b16000       4 rw--- 000000000000a000 008:00002 libnss_files-2.5.so
00002af8d4b17000  768000 rw-s- 0000000000000000 000:00009 zero (deleted)
00007fffc95fe000      84 rw--- 00007ffffffea000 000:00000   [ stack ]
ffffffffff600000    8192 ----- 0000000000000000 000:00000   [ anon ]
mapped: 933712K    writeable/private: 4304K    shared: 768000K
The last line is very important:
mapped: 933712K total amount of memory mapped to files
writeable/private: 4304K the amount of private address space
shared: 768000K the amount of address space this process is sharing with others
=> Related: : Linux find the memory used by a program / process using pmap command
#11 and #12: netstat and ss - Network Statistics
The command netstat displays network connections, routing tables, interface statistics, masquerade connections, and multicast memberships. ss command is used to dump socket statistics. It allows showing information similar to netstat. See the following resources about ss and netstat commands:
ss: Display Linux TCP / UDP Network and Socket Information
Get Detailed Information About Particular IP address Connections Using netstat Command
#13: iptraf - Real-time Network Statistics
The iptraf command is interactive colorful IP LAN monitor. It is an ncurses-based IP LAN monitor that generates various network statistics including TCP info, UDP counts, ICMP and OSPF information, Ethernet load info, node stats, IP checksum errors, and others. It can provide the following info in easy to read format:
Network traffic statistics by TCP connection
IP traffic statistics by network interface
Network traffic statistics by protocol
Network traffic statistics by TCP/UDP port and by packet size
Network traffic statistics by Layer2 address

Fig.02: General interface statistics: IP traffic statistics by network interface

Fig.03 Network traffic statistics by TCP connection
#14: tcpdump - Detailed Network Traffic Analysis
The tcpdump is simple command that dump traffic on a network. However, you need good understanding of TCP/IP protocol to utilize this tool. For.e.g to display traffic info about DNS, enter:
# tcpdump -i eth1 'udp port 53'
To display all IPv4 HTTP packets to and from port 80, i.e. print only packets that contain data, not, for example, SYN and FIN packets and ACK-only packets, enter:
# tcpdump 'tcp port 80 and (((ip[2:2] - ((ip[0]&0xf)<<2)) - ((tcp[12]&0xf0)>>2)) != 0)'
To display all FTP session to 202.54.1.5, enter:
# tcpdump -i eth1 'dst 202.54.1.5 and (port 21 or 20'
To display all HTTP session to 192.168.1.5:
# tcpdump -ni eth0 'dst 192.168.1.5 and tcp and port http'
Use wireshark to view detailed information about files, enter:
# tcpdump -n -i eth1 -s 0 -w output.txt src or dst port 80
#15: strace - System Calls
Trace system calls and signals. This is useful for debugging webserver and other server problems. See how to use to trace the process and see What it is doing.
#16: /Proc file system - Various Kernel Statistics
/proc file system provides detailed information about various hardware devices and other Linux kernel information. See Linux kernel /proc documentations for further details. Common /proc examples:
# cat /proc/cpuinfo
# cat /proc/meminfo
# cat /proc/zoneinfo
# cat /proc/mounts
17#: Nagios - Server And Network Monitoring
Nagios is a popular open source computer system and network monitoring application software. You can easily monitor all your hosts, network equipment and services. It can send alert when things go wrong and again when they get better. FAN is "Fully Automated Nagios". FAN goals are to provide a Nagios installation including most tools provided by the Nagios Community. FAN provides a CDRom image in the standard ISO format, making it easy to easilly install a Nagios server. Added to this, a wide bunch of tools are including to the distribution, in order to improve the user experience around Nagios.
18#: Cacti - Web-based Monitoring Tool
Cacti is a complete network graphing solution designed to harness the power of RRDTool's data storage and graphing functionality. Cacti provides a fast poller, advanced graph templating, multiple data acquisition methods, and user management features out of the box. All of this is wrapped in an intuitive, easy to use interface that makes sense for LAN-sized installations up to complex networks with hundreds of devices. It can provide data about network, CPU, memory, logged in users, Apache, DNS servers and much more. See how to install and configure Cacti network graphing tool under CentOS / RHEL.
#19: KDE System Guard - Real-time Systems Reporting and Graphing
KSysguard is a network enabled task and system monitor application for KDE desktop. This tool can be run over ssh session. It provides lots of features such as a client/server architecture that enables monitoring of local and remote hosts. The graphical front end uses so-called sensors to retrieve the information it displays. A sensor can return simple values or more complex information like tables. For each type of information, one or more displays are provided. Displays are organized in worksheets that can be saved and loaded independently from each other. So, KSysguard is not only a simple task manager but also a very powerful tool to control large server farms.

Fig.05 KDE System Guard {Image credit: Wikipedia}
See the KSysguard handbook for detailed usage.
#20: Gnome System Monitor - Real-time Systems Reporting and Graphing
The System Monitor application enables you to display basic system information and monitor system processes, usage of system resources, and file systems. You can also use System Monitor to modify the behavior of your system. Although not as powerful as the KDE System Guard, it provides the basic information which may be useful for new users:
Displays various basic information about the computer's hardware and software.
Linux Kernel version
GNOME version
Hardware
Installed memory
Processors and speeds
System Status
Currently available disk space
Processes
Memory and swap space
Network usage
File Systems
Lists all mounted filesystems along with basic information about each.

Fig.06 The Gnome System Monitor application
Bonus: Additional Tools
A few more tools:
nmap - scan your server for open ports.
lsof - list open files, network connections and much more.
ntop web based tool - ntop is the best tool to see network usage in a way similar to what top command does for processes i.e. it is network traffic monitoring software. You can see network status, protocol wise distribution of traffic for UDP, TCP, DNS, HTTP and other protocols.
Conky - Another good monitoring tool for the X Window System. It is highly configurable and is able to monitor many system variables including the status of the CPU, memory, swap space, disk storage, temperatures, processes, network interfaces, battery power, system messages, e-mail inboxes etc.
GKrellM - It can be used to monitor the status of CPUs, main memory, hard disks, network interfaces, local and remote mailboxes, and many other things.
vnstat - vnStat is a console-based network traffic monitor. It keeps a log of hourly, daily and monthly network traffic for the selected interface(s).
htop - htop is an enhanced version of top, the interactive process viewer, which can display the list of processes in a tree form.
mtr - mtr combines the functionality of the traceroute and ping programs in a single network diagnostic tool.

Thanking You
Hope U Like it.......

Oracle Linux 7

Fedora 20 in Virtual box

Nagios 4.0.7

Roboform in linux

Ubuntu server 12.04
Zimbra Desktop 7
>